A look inside the dashboards
These are real screenshots from the three demos. The businesses and figures are made up; the views and features work.
Cockpit
What is going on today?
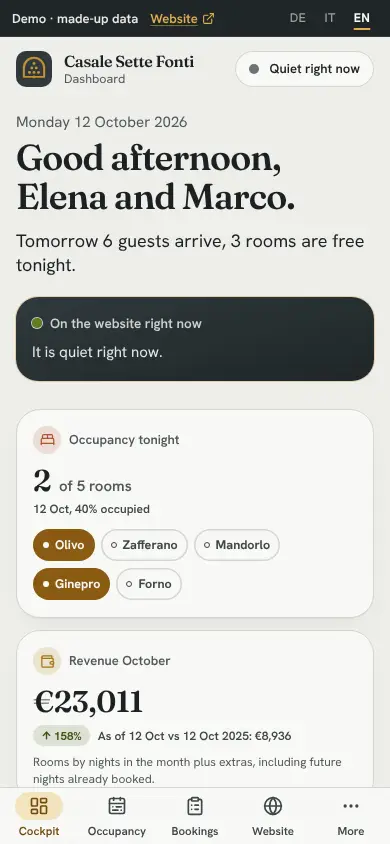
The main figures are together: what’s happening today, how many rooms are occupied, new bookings and how the month is going.
Example from the demo (made-up data): Three of five rooms occupied, 16 bookings in 7 days, 40 percent direct share over 30 days.
- Live box: who was on the website in the last five minutes. If nobody is, it says “Quiet right now.”
- Latest bookings through the website, in real time.
- Today's occupancy, room by room.
- Share of direct bookings over 30 days, with last year.
Shown in Demo 1, Casale Sette Fonti
View dashboard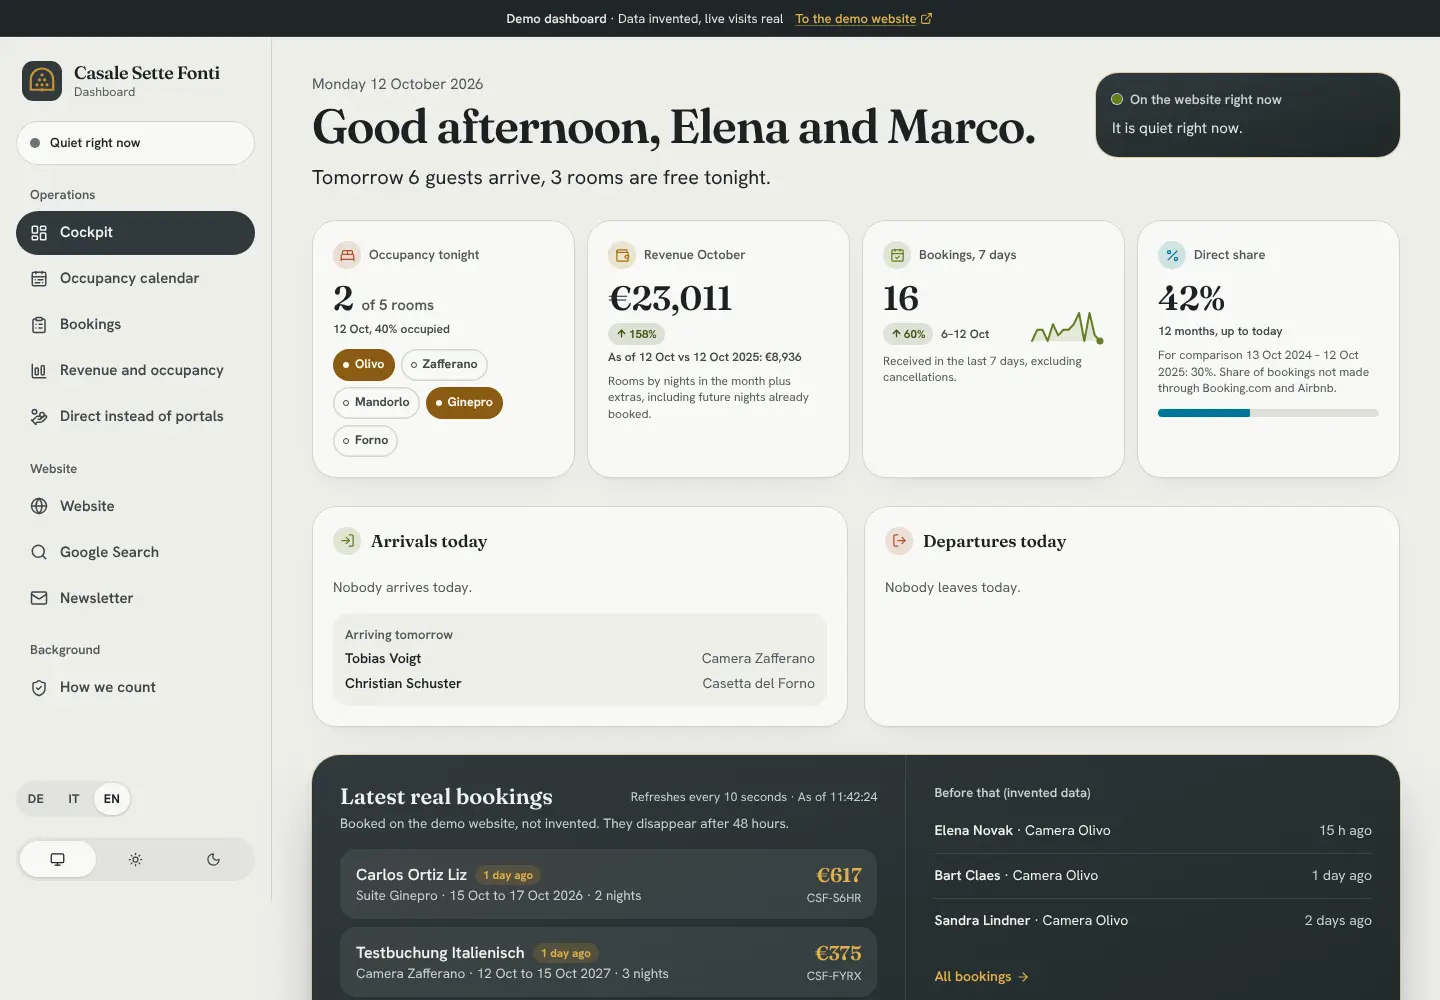
Occupancy calendar
When is which room occupied?
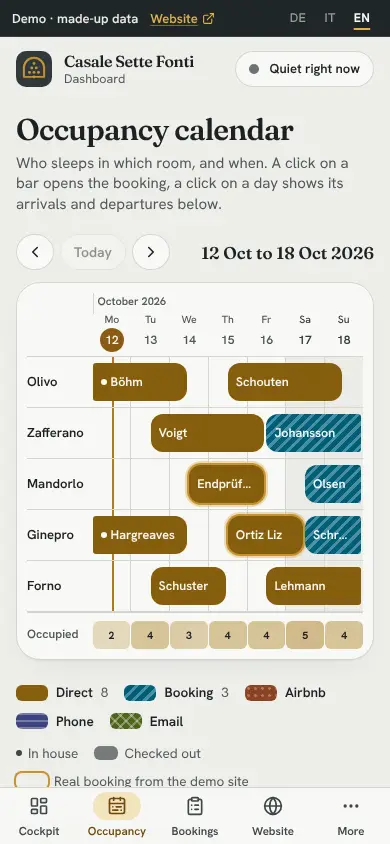
Each booking appears as a bar on the calendar. Colour and pattern show whether it came directly or through a portal. Empty nights are easy to spot.
Example from the demo (made-up data): Seven weeks at a glance, direct bookings in mustard, Booking hatched.
- A bar is a booking, here a direct one.
- The line marks today.
- The bottom row counts occupied rooms per day.
- Three, four or seven weeks, forward and back.
Shown in Demo 1, Casale Sette Fonti
View dashboard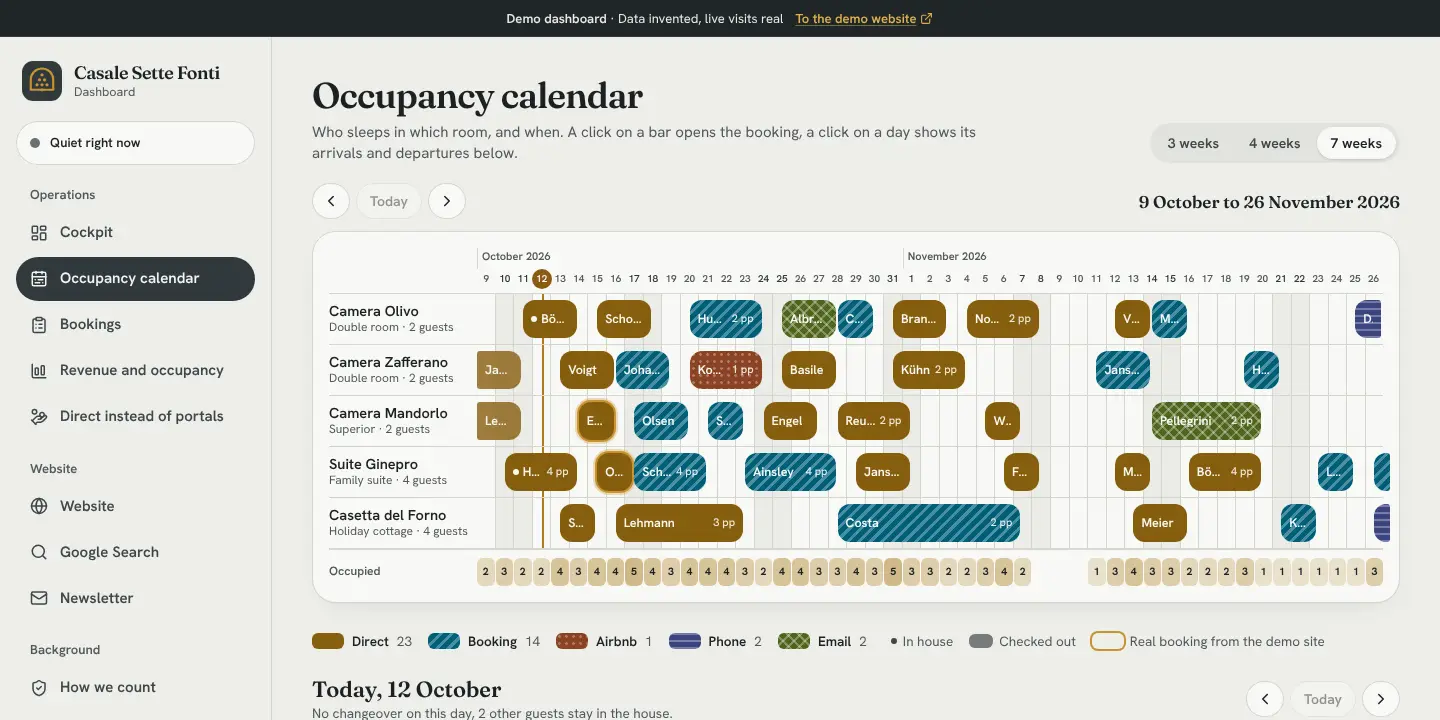
Dates and cancellation risk
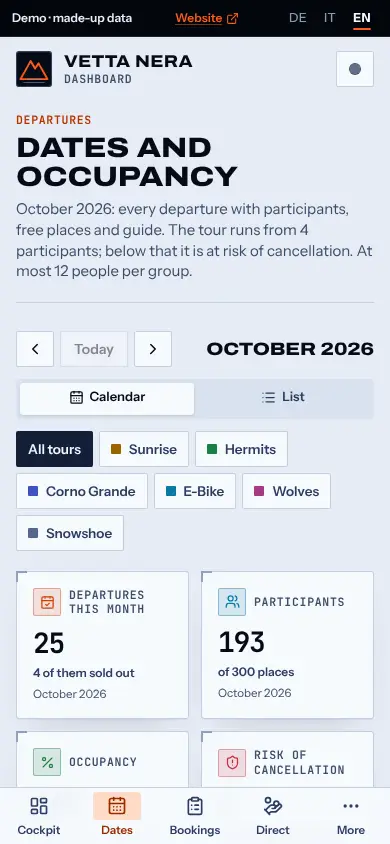
Which departure runs, which is at risk?
See booked places, remaining places and the guide for each departure. If a date falls below your minimum group size, you get a timely heads-up.
Example from the demo (made-up data): 25 departures in October, 192 participants, 64 percent occupancy, 1 departure at risk.
- Cancellation risk: departures below 4 participants, visible in time.
- Departures, participants and occupancy for the month.
- Filter by tour, each tour in its own colour.
- Hatched: cancelled departures, visible in the calendar at once.
Shown in Demo 2, Vetta Nera
View dashboard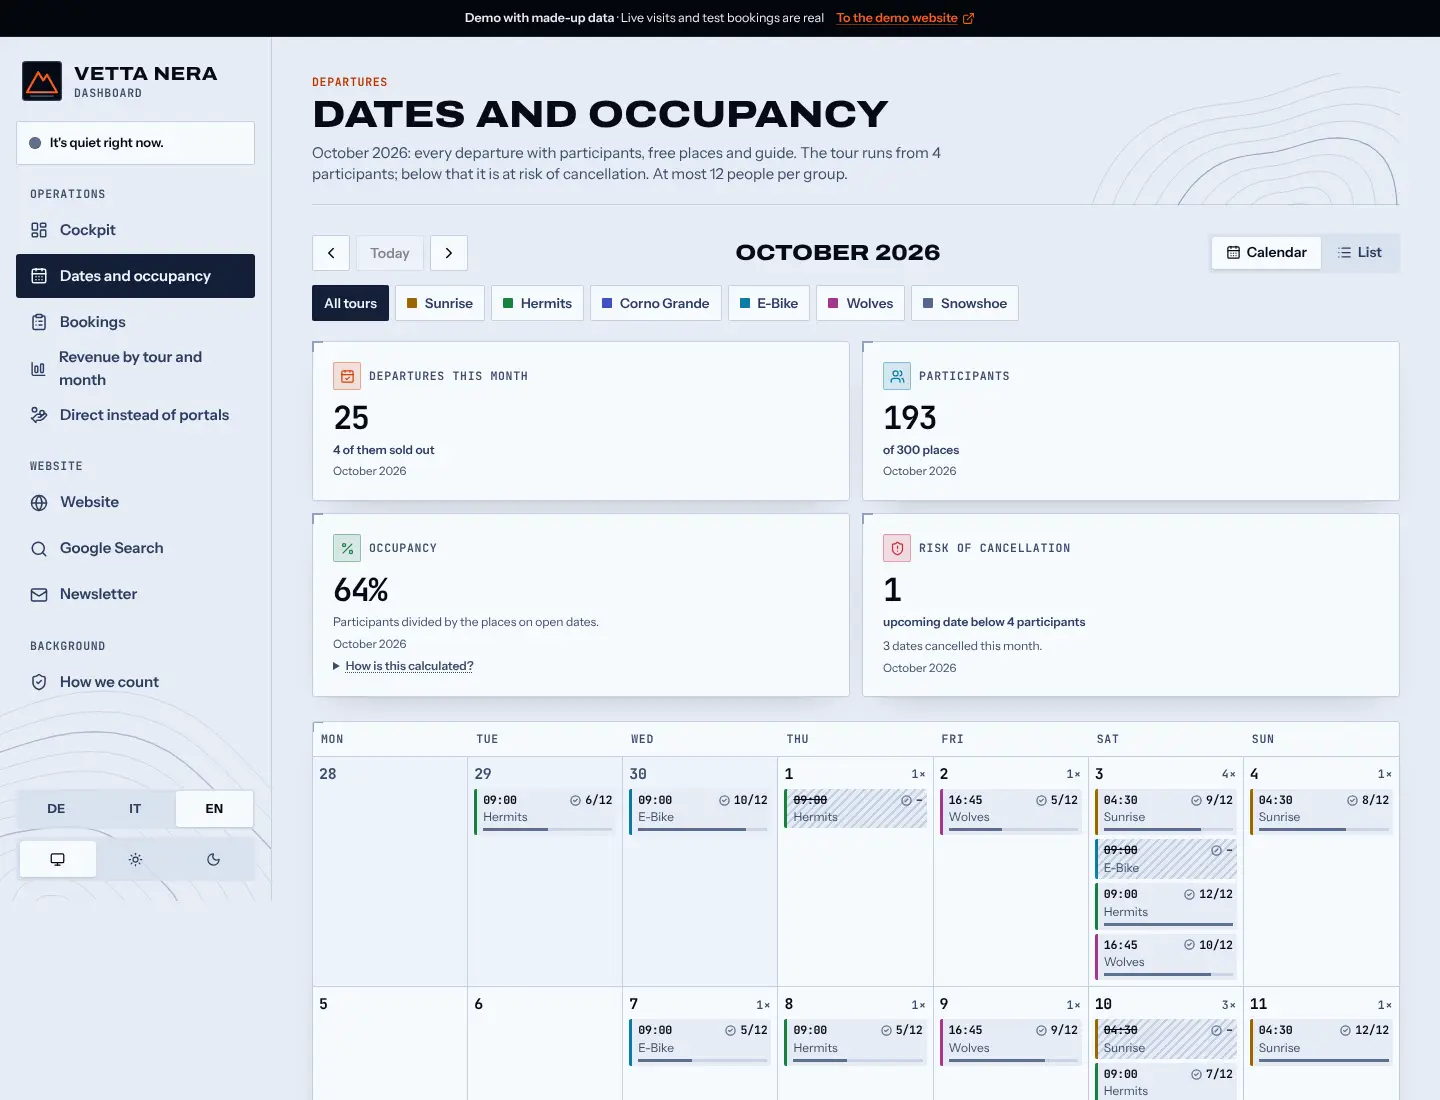
Slot heatmap
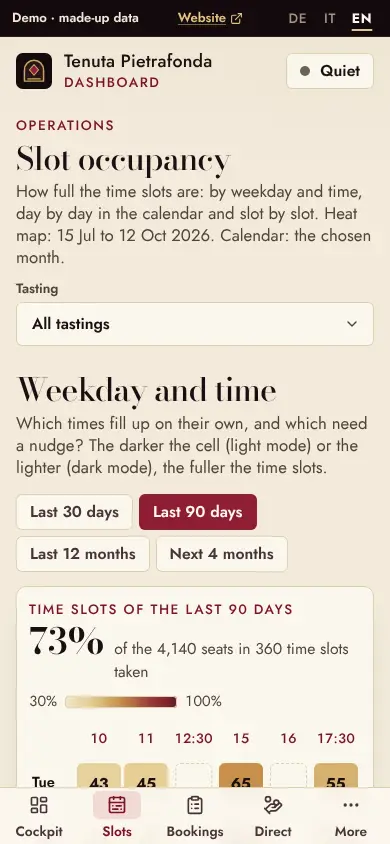
Which times work, which need a push?
See which days and times are popular for tastings. This makes it easier to decide whether another slot would be useful.
Example from the demo (made-up data): 72 percent of places taken, fullest is Saturday 3 pm at 98 percent.
- The darker the cell, the fuller the session.
- Overall occupancy for the chosen period.
- Dashed: nothing takes place at this time.
- Period and experience selectable, including the next 4 months.
Shown in Demo 3, Tenuta Pietrafonda
View dashboard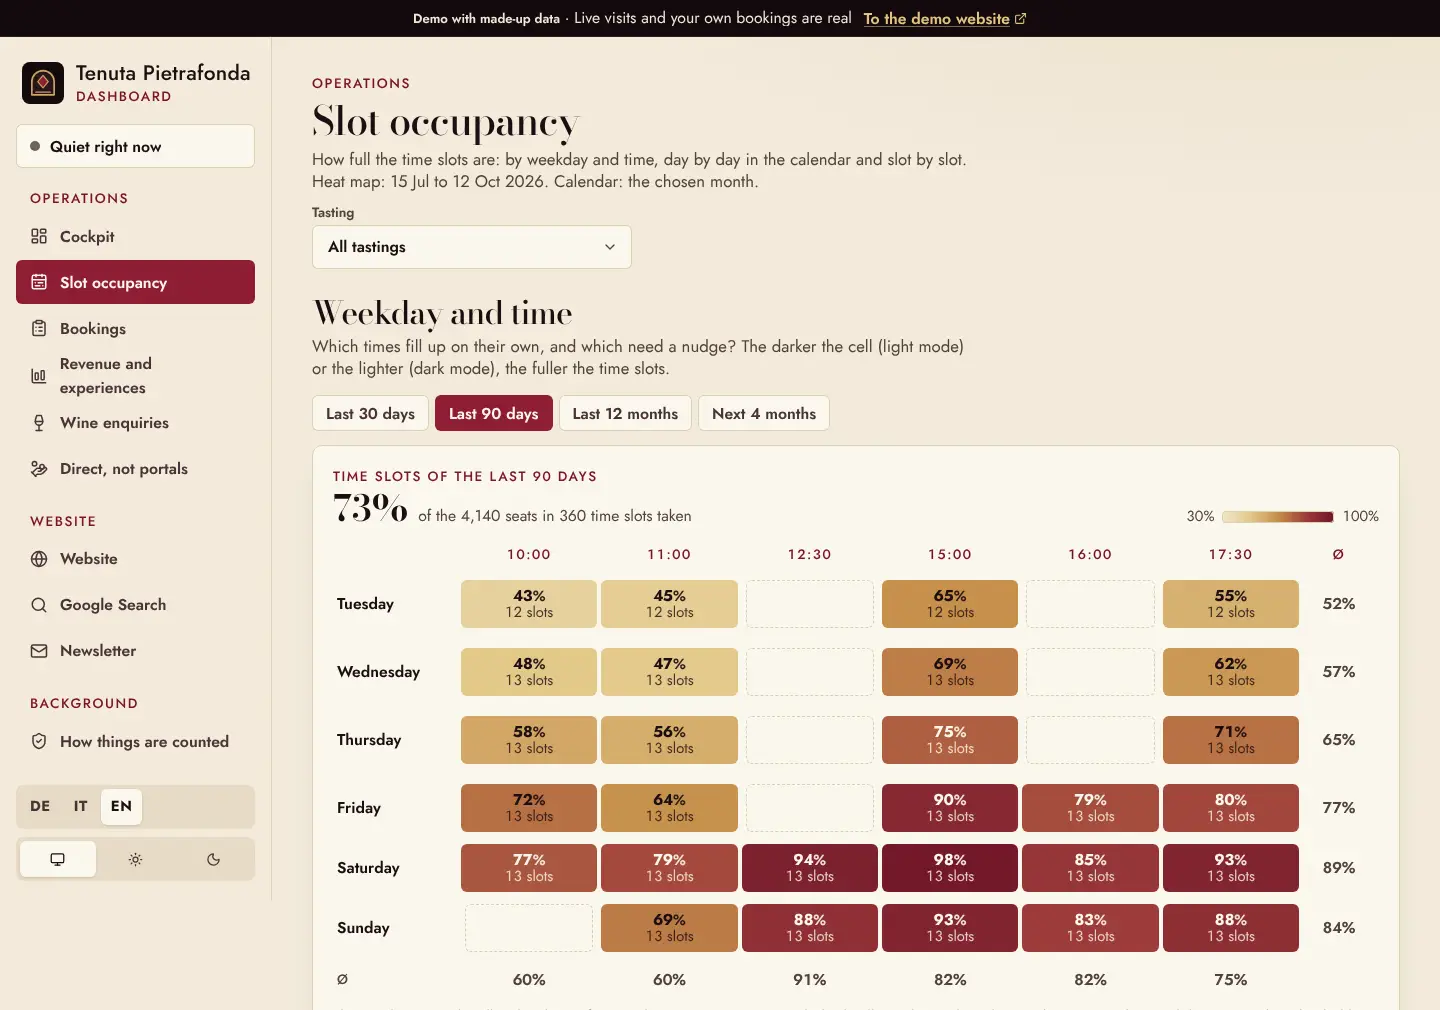
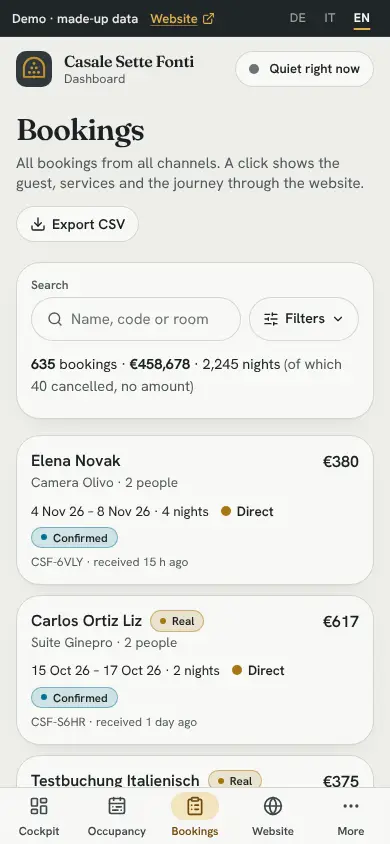
Bookings
Who booked, and where did the guest come from?
Bookings from every channel come together here. For direct bookings, you can also see how the guest found their way to you.
Example from the demo (made-up data): 629 bookings, €454,724, filterable by channel, status and room.
- Search by name, code or room.
- The channel of every booking at a glance.
- Real bookings from the demo are marked.
- Export as CSV for your bookkeeping.
Shown in Demo 1, Casale Sette Fonti
View dashboard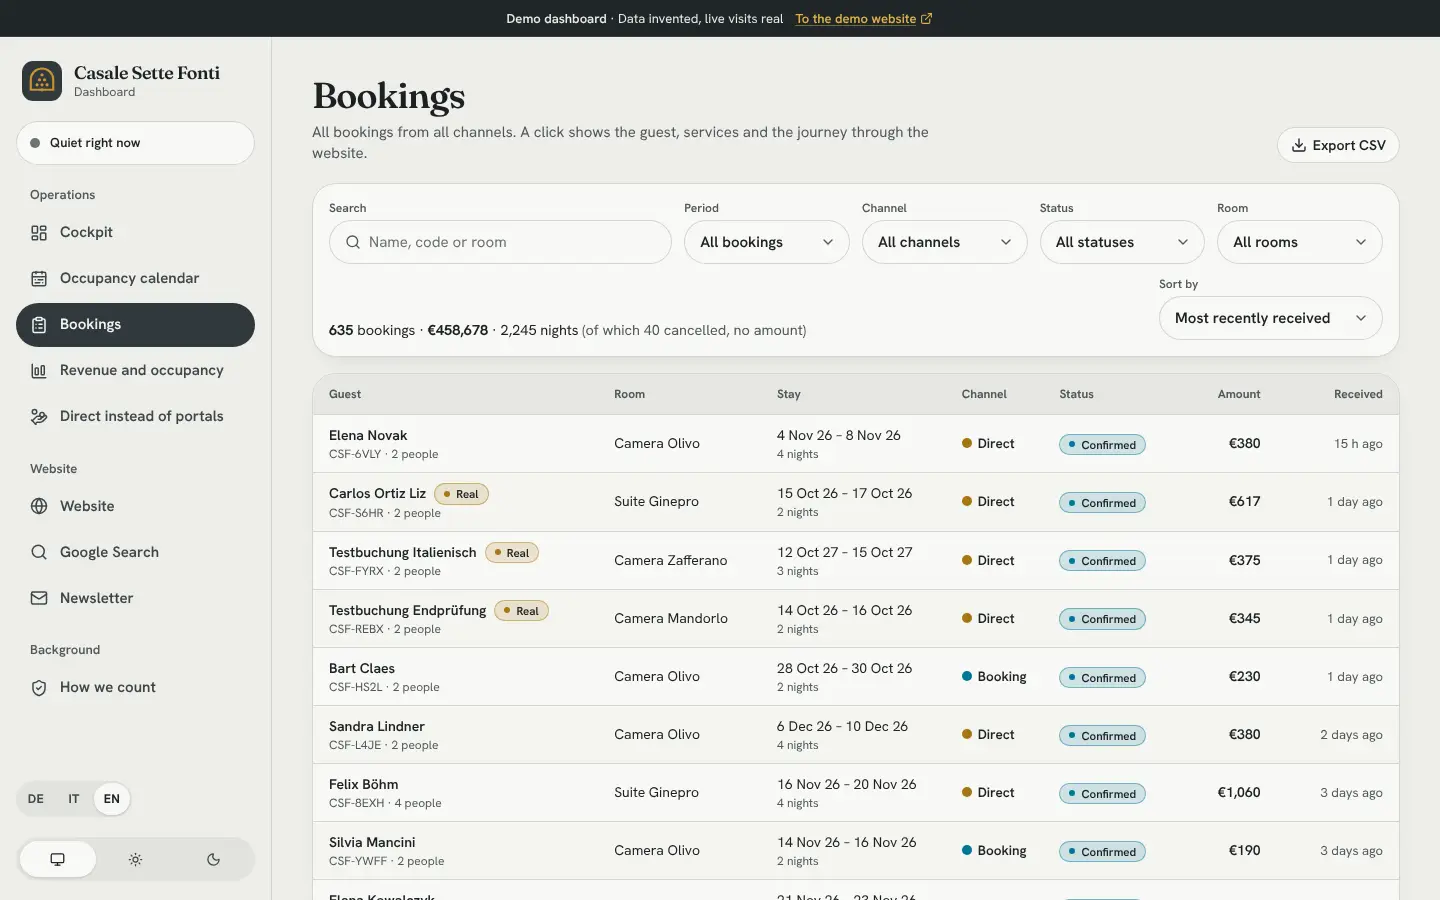
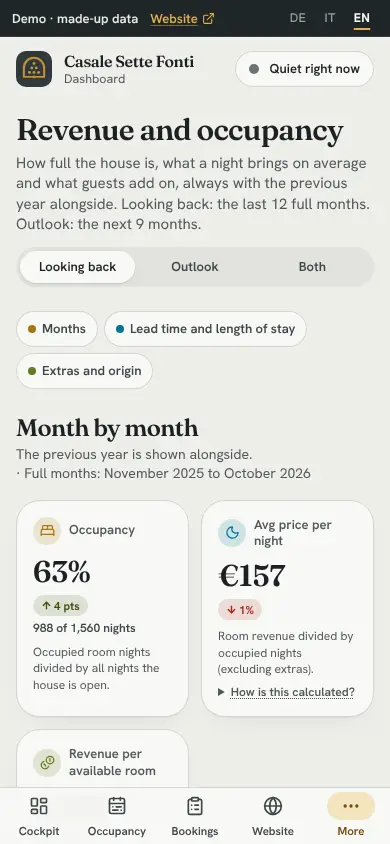
Revenue and occupancy
How is the business doing against last year?
Occupancy, nightly rate and revenue are shown month by month, with last year alongside for comparison. You can also see booking lead time, length of stay and extras.
Example from the demo (made-up data): 63 percent occupancy, €157 per night, €204,861 revenue in 12 months.
- Occupancy as a share of open nights.
- Total revenue including extras.
- The months compared with last year.
- Look back, look ahead or both.
Shown in Demo 1, Casale Sette Fonti
View dashboard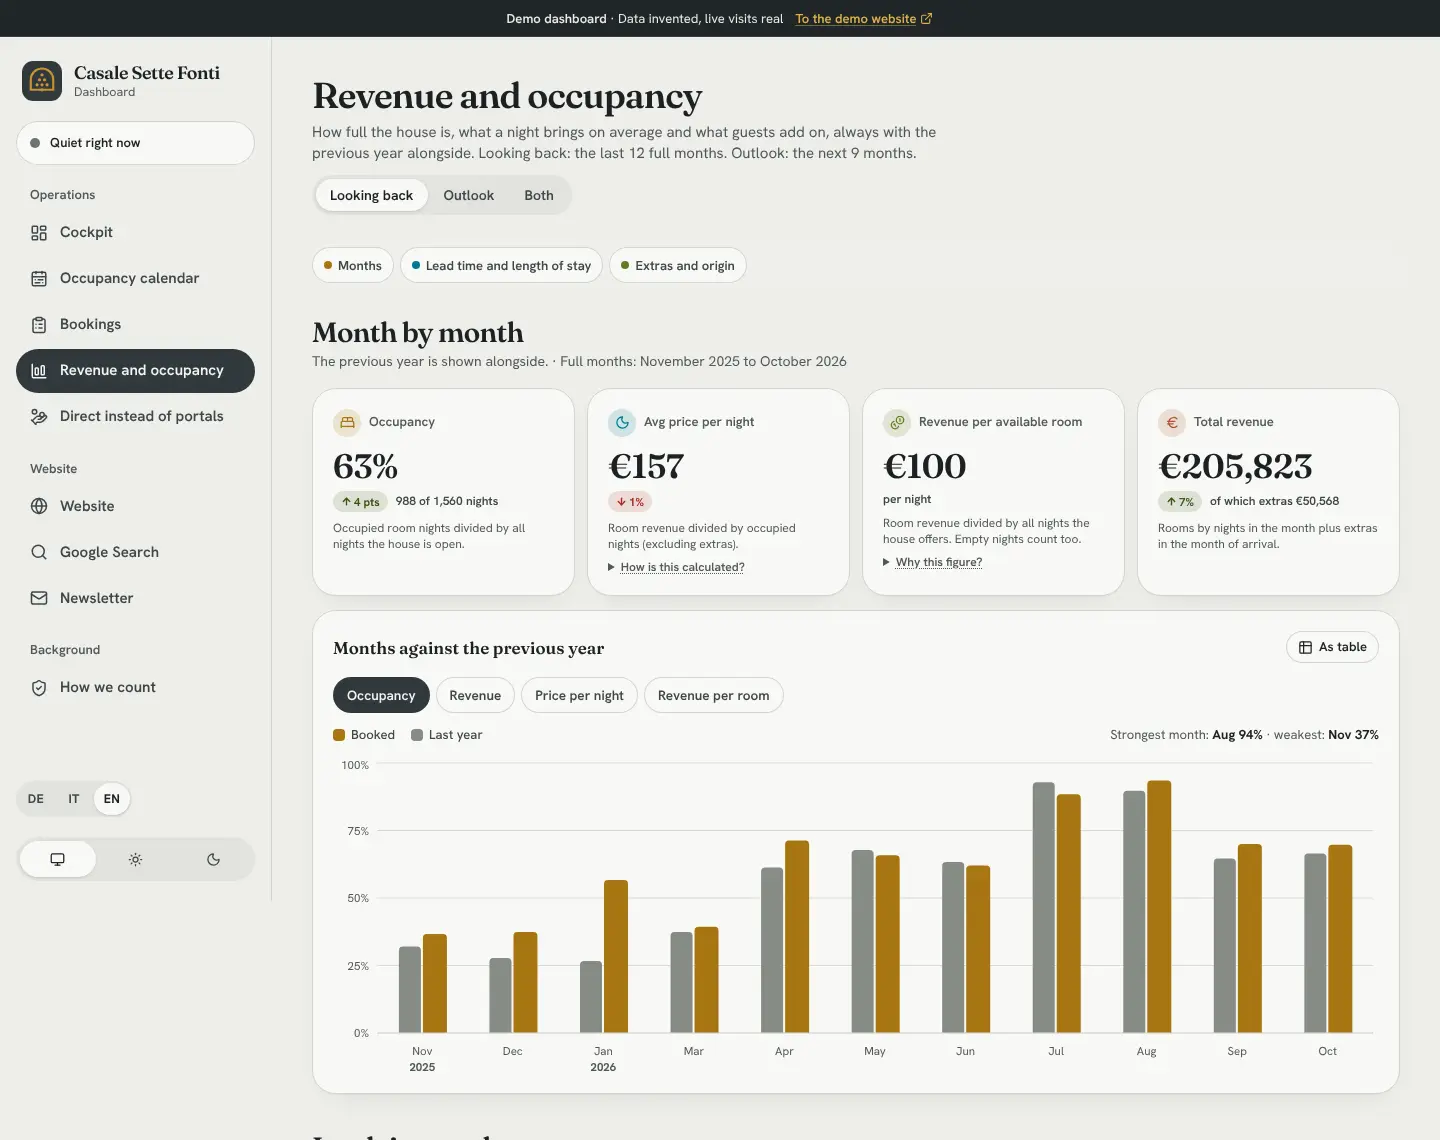
Direct vs portal
How much commission stays with me?
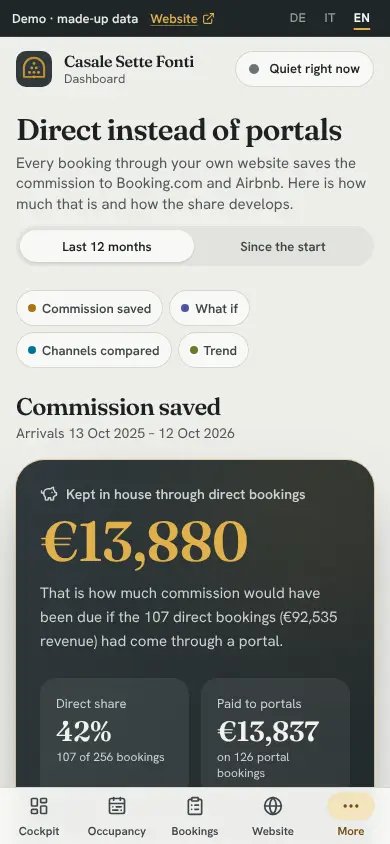
See how many bookings came directly and how much commission that would mean you didn’t pay. You can adjust the commission rate used in the calculation.
Example from the demo (made-up data): €13,794 commission that did not go to a portal, on 106 direct bookings, calculated at 15 percent.
- The commission over the last 12 months that did not go to portals.
- Direct share and what went to portals.
- Slider: how much commission would be saved at a different direct share?
- Revenue shares of the channels in one bar, with the table below.
Shown in Demo 1, Casale Sette Fonti
View dashboard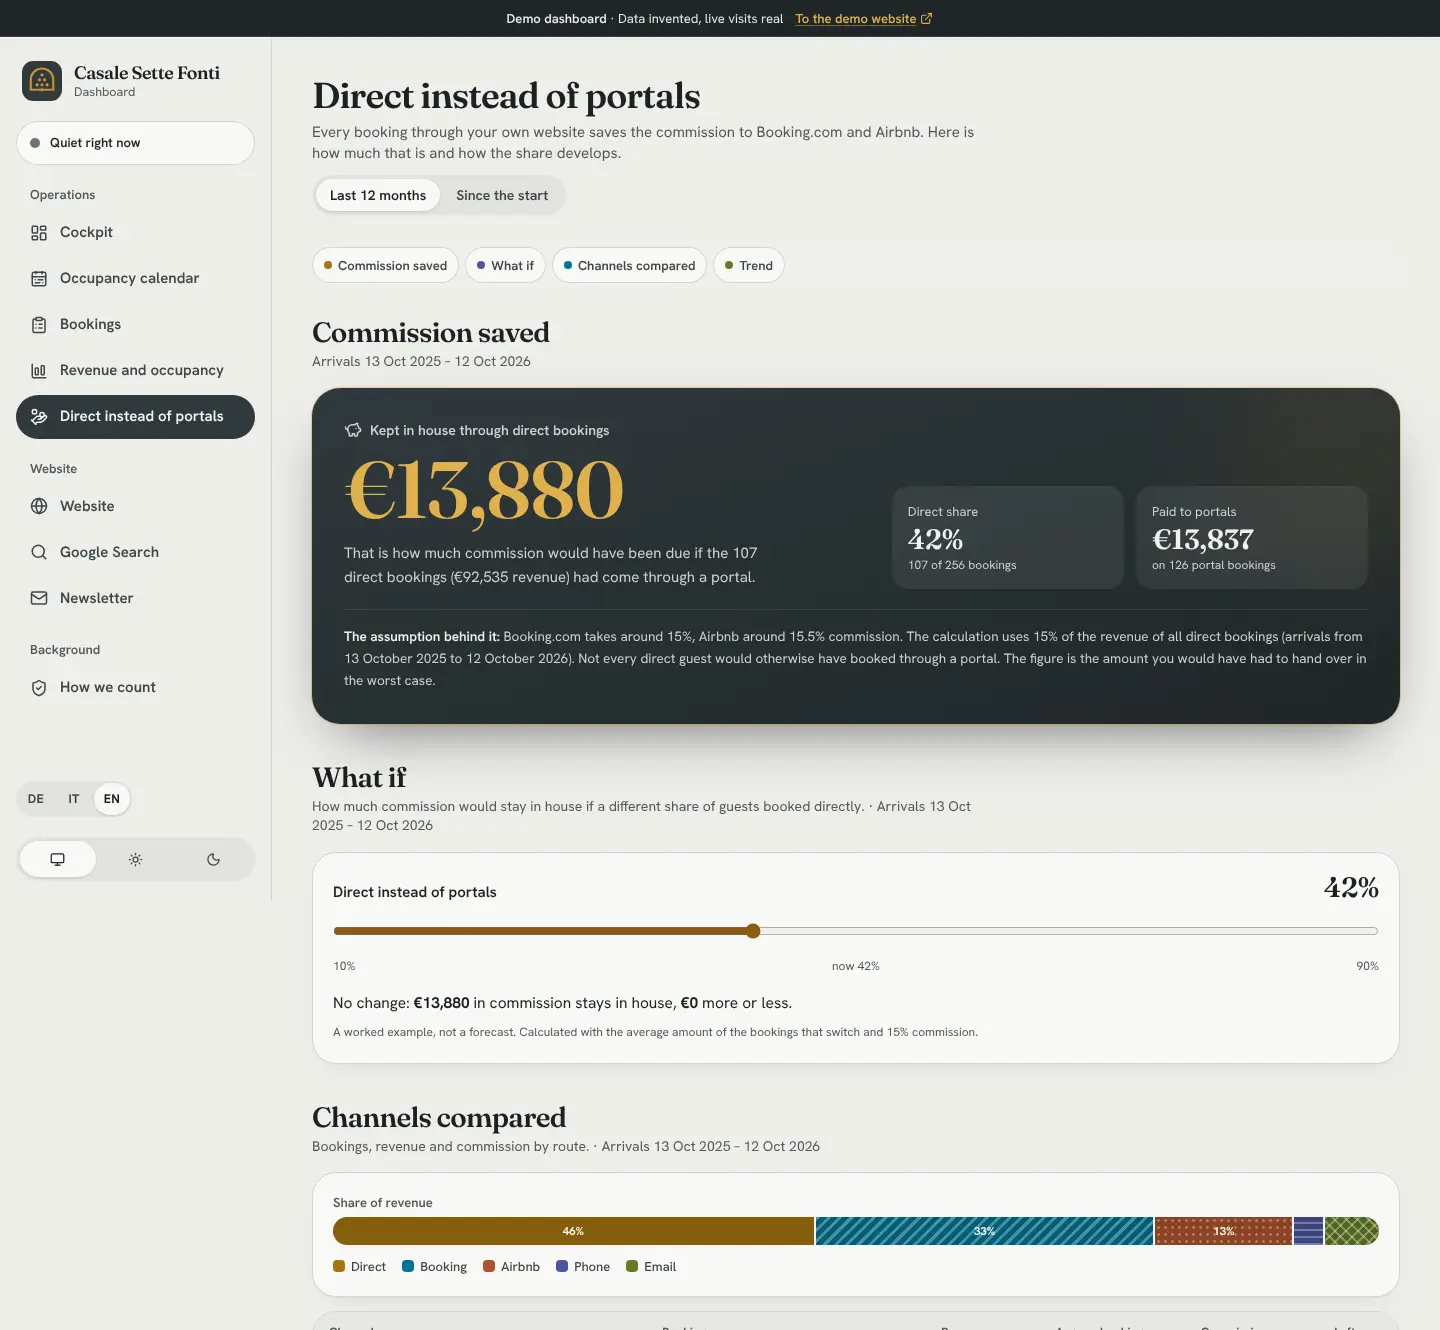
Wine enquiries
Which wines are asked for?
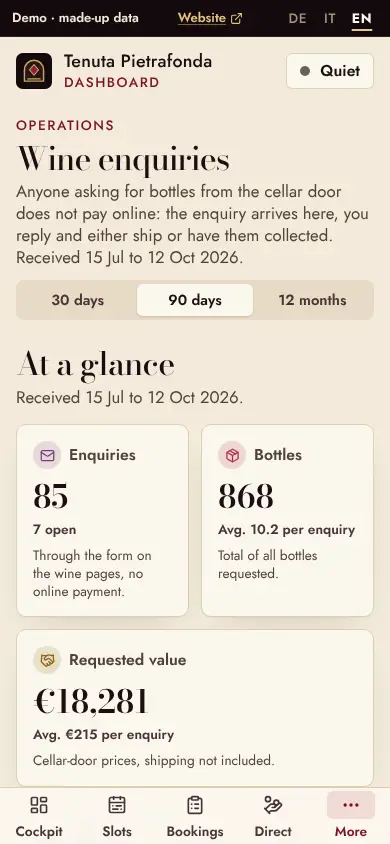
Guests can enquire about bottles through a form. You reply and arrange collection or shipping yourself. No online shop needed.
Example from the demo (made-up data): 85 enquiries, 879 bottles, €18,592 requested value, 54 percent collect.
- Enquiries through the form, open ones are marked.
- Requested value, without shipping costs.
- Collection or shipping compared.
- Enquiries per wine, by bottles or by value.
Shown in Demo 3, Tenuta Pietrafonda
View dashboard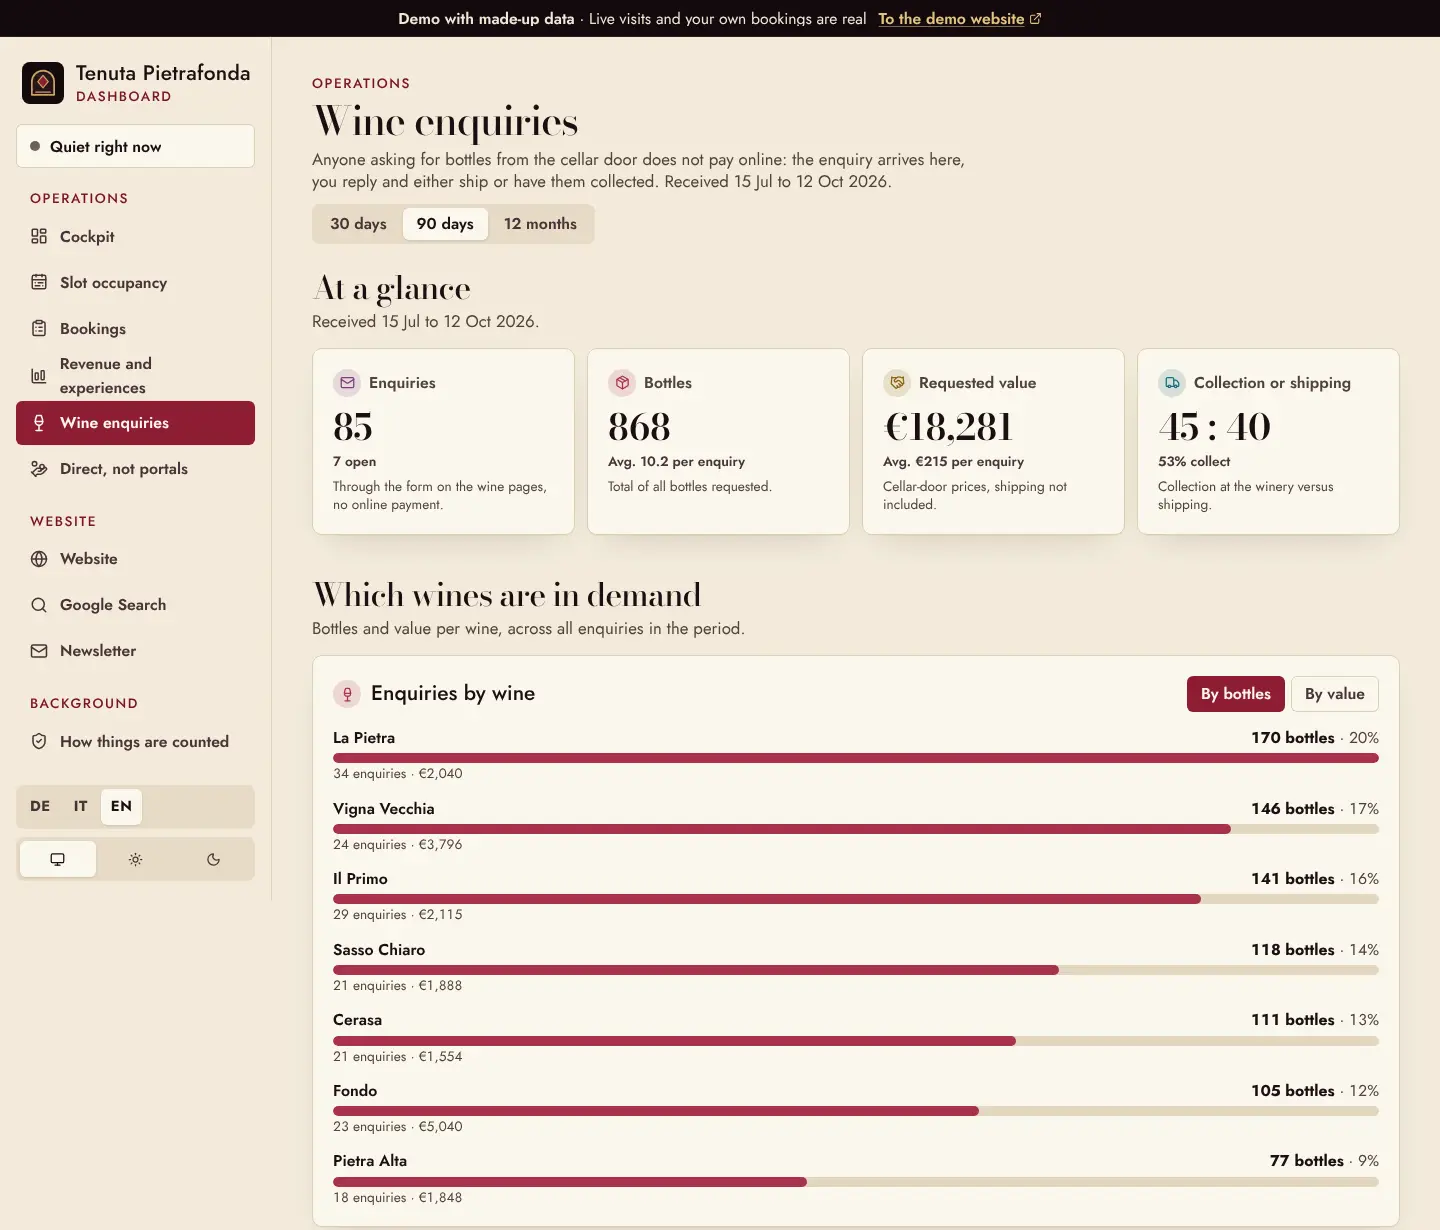
Website
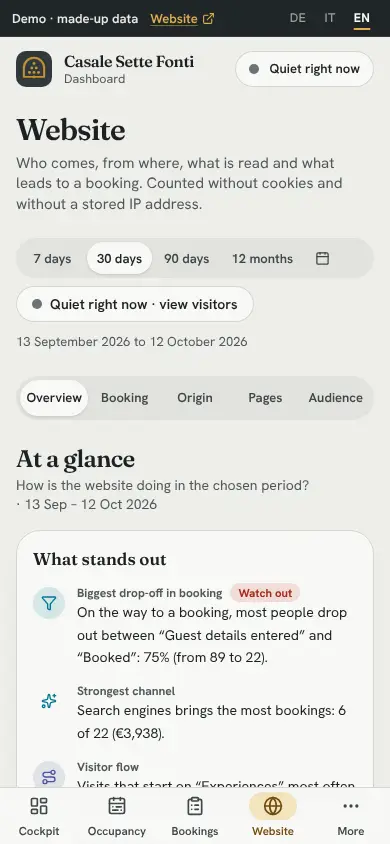
Who comes, and what leads to a booking?
Visits, traffic sources and pages viewed sit alongside bookings. This helps you see what brought guests to your site and where they may have dropped off.
Example from the demo (made-up data): 2,847 visitors in 30 days, 23 direct bookings, 32 newsletter sign-ups.
- “What stands out” in sentences, no charts to read.
- Visitors, counted without a cookie.
- Page views with trend.
- Period of your choice, up to 12 months.
Shown in Demo 1, Casale Sette Fonti
View dashboard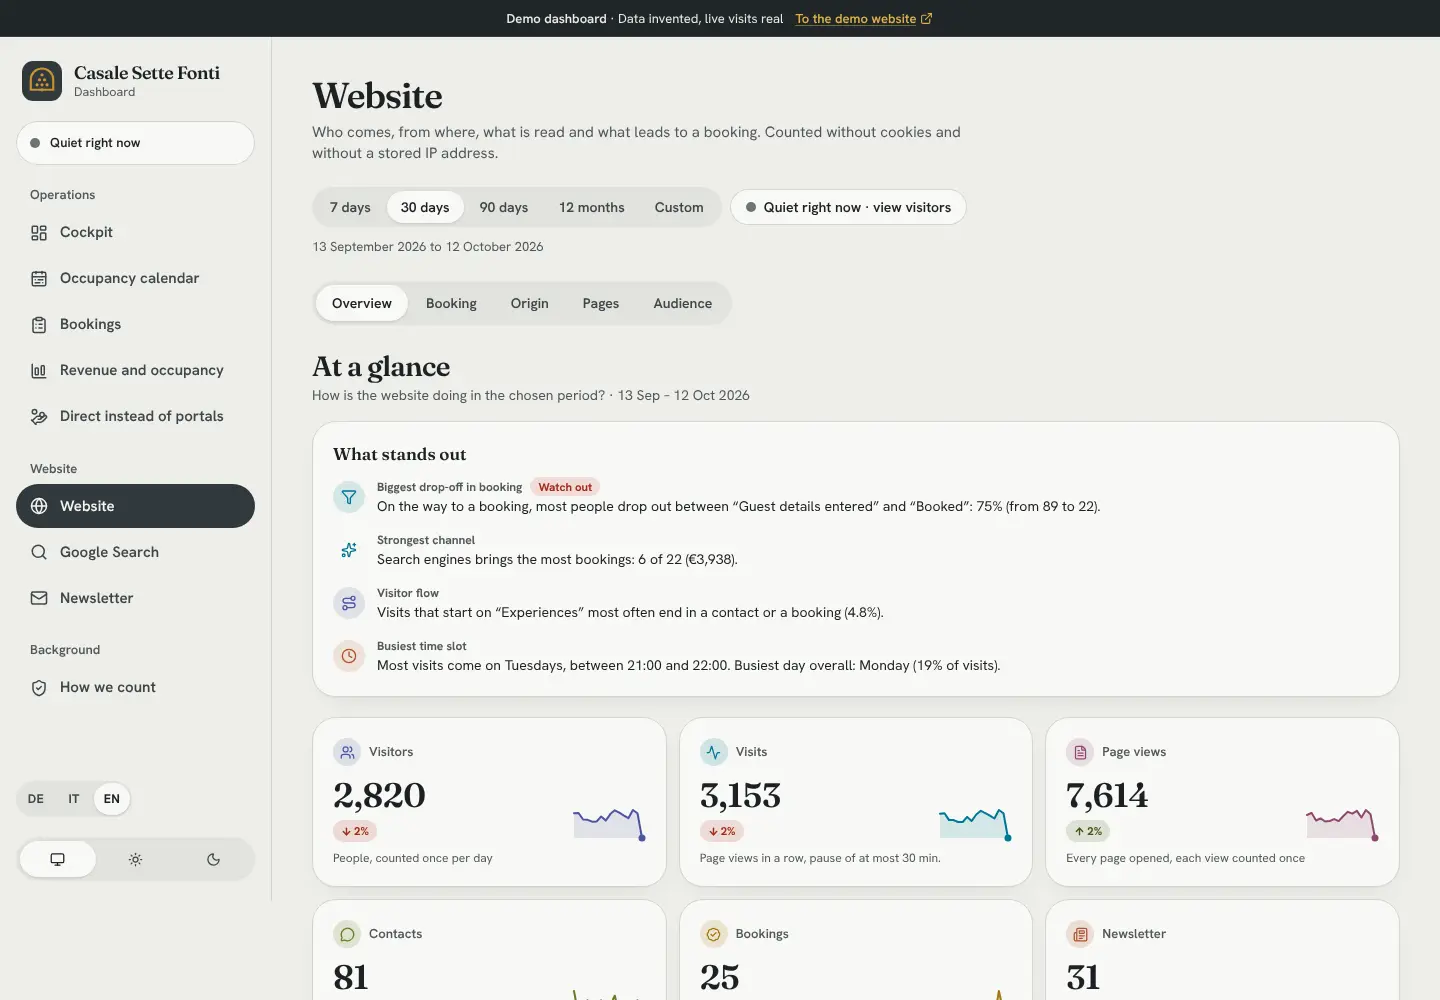
Google Search
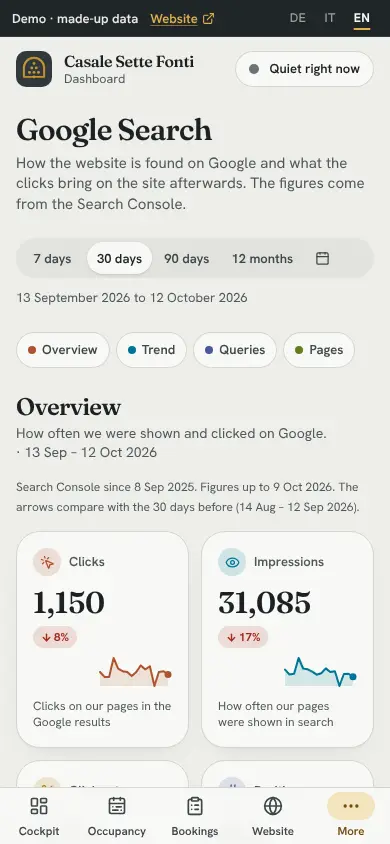
How do guests find me on Google?
Clicks, impressions and search positions from Google Search Console appear alongside your website visitor figures.
Example from the demo (made-up data): 1,173 clicks in 30 days, average position 8.9.
- Clicks from Google search.
- Impressions and click rate over time.
- Last year can be shown or hidden.
- Also: search queries and pages that get found.
Shown in Demo 1, Casale Sette Fonti
View dashboard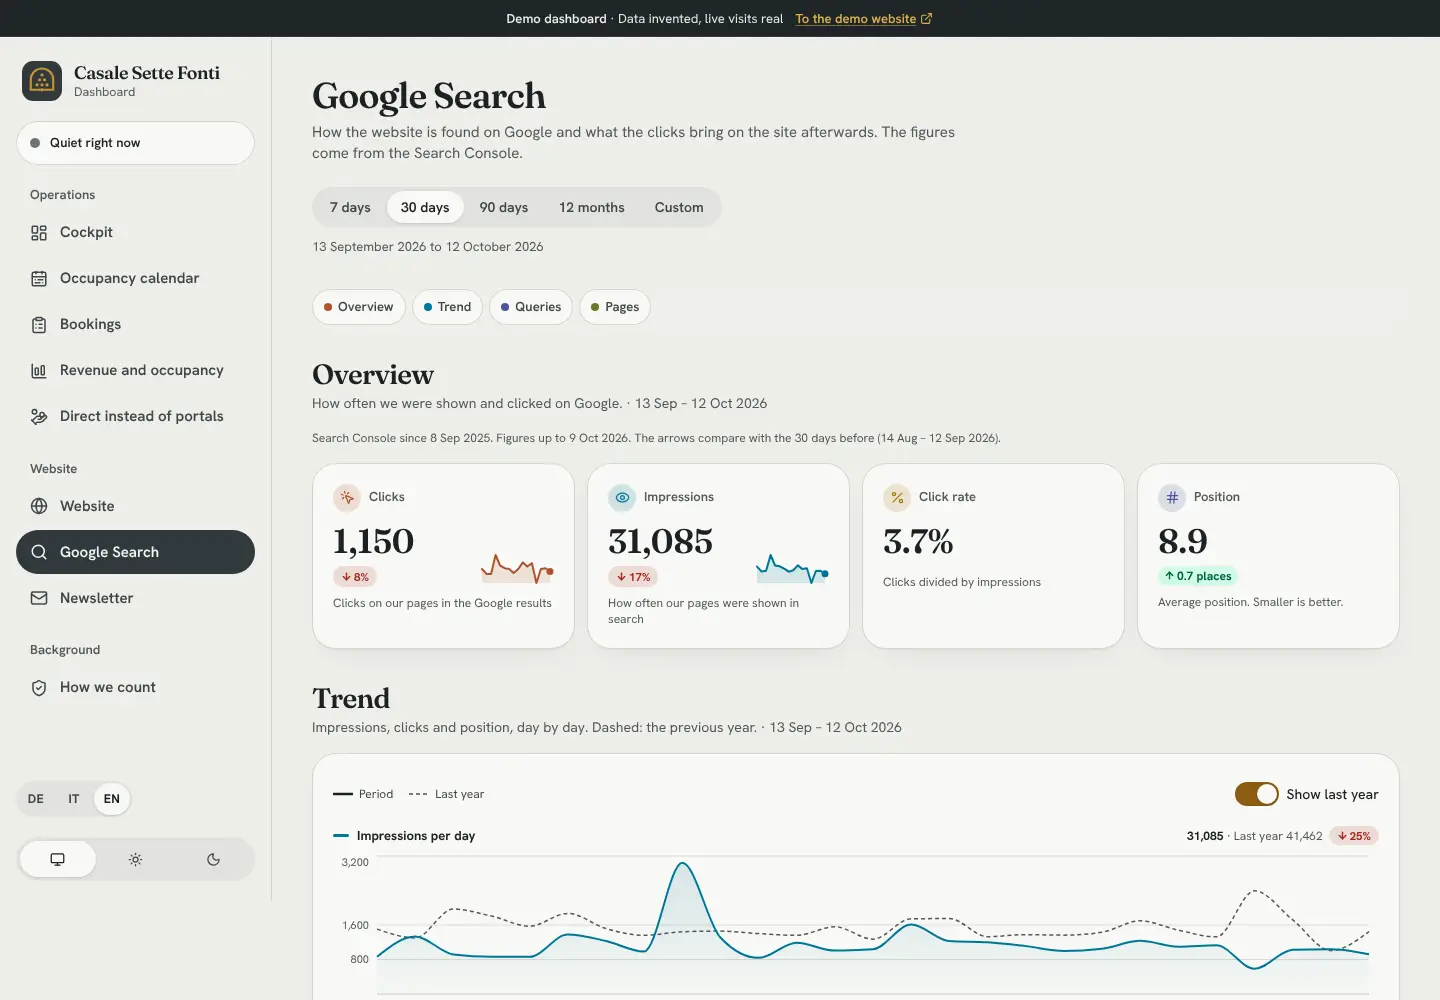
Newsletter
Which sign-up box brings subscribers?
See how often each newsletter form was shown and which ones brought in sign-ups.
Example from the demo (made-up data): 1,289 times seen, 32 sign-ups. The box on the newsletter page works best, at 16 percent.
- Seen, clicked into the field, signed up.
- Sign-up rate per box.
- Boxes compared side by side.
- Phone against computer.
Shown in Demo 1, Casale Sette Fonti
View dashboard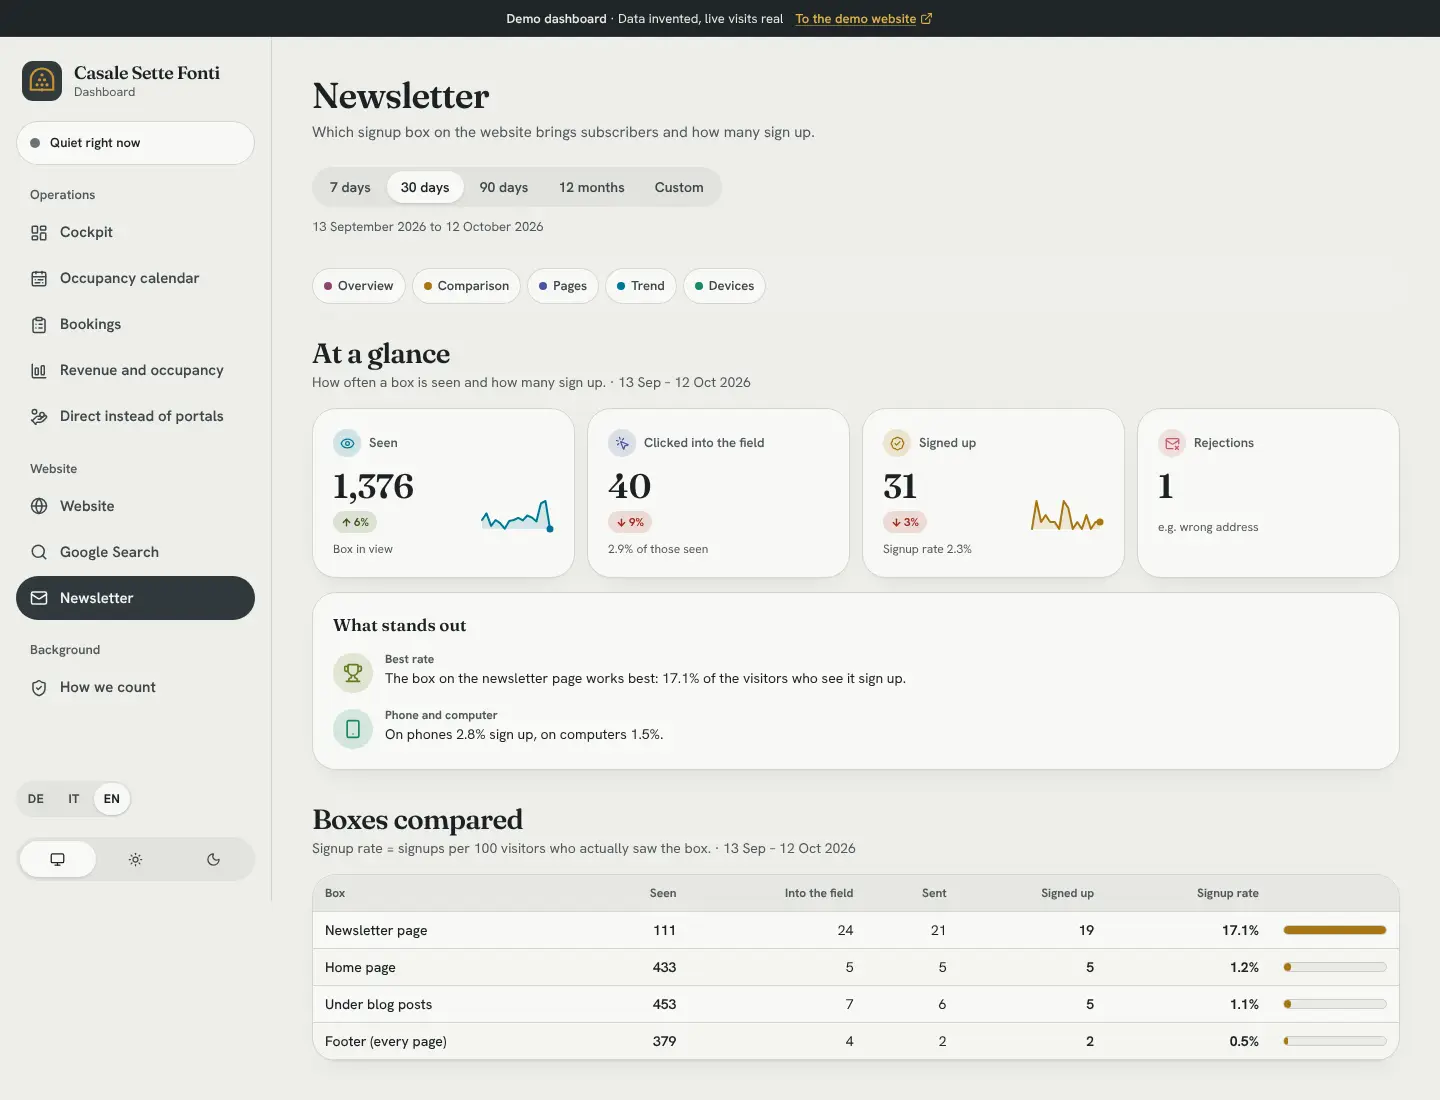
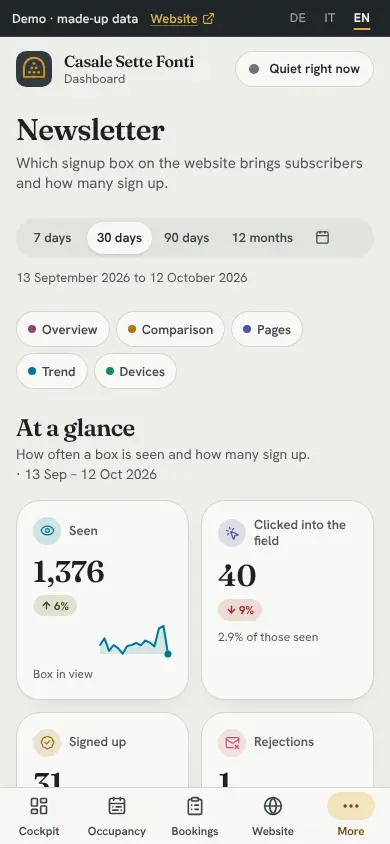
The dashboard is tailored to your business. Tour operators need dates and capacity; wineries need tasting slots and wine enquiries. Every dashboard includes bookings and revenue.
What your website can do for you
Your website, booking system and reporting work together. When a guest books directly, you can later see how they found you and what caught their interest.
Your website
A design made for your business, quick to load and easy to read on a phone. The domain is yours.
Bookings on your own site
Guests can check availability and book rooms or activities directly with you, without a portal commission.
Understand visits and bookings
See how guests find your site and what they do there, without Google Analytics or cookies.
A dashboard for your day-to-day
Bookings, occupancy and revenue at a glance, even when you’re away from your desk.
Tell me about your business
What’s already working well on your website, and what would you like to change? Just drop me a line. I reply in German, English or Spanish.